How to get even or odd rows in Pandas Dataframe?

There is a simple method without applying any function of filters.


import pandas as pd

df=pd.read_csv("http://bit.ly/drinksbycountry")


df.head()


country beer_servings spirit_servings wine_servings total_litres_of_pure_alcohol continent
0 Afghanistan 0 0 0 0.0 Asia
1 Albania 89 132 54 4.9 Europe
2 Algeria 25 0 14 0.7 Africa
3 Andorra 245 138 312 12.4 Europe
4 Angola 217 57 45 5.9 Africa


df.shape

(193, 6)


# Dataframe has 193 records, lets get only even rows without applying any filter.

df[::2].head(10)


country beer_servings spirit_servings wine_servings total_litres_of_pure_alcohol continent
0 Afghanistan 0 0 0 0.0 Asia
2 Algeria 25 0 14 0.7 Africa
4 Angola 217 57 45 5.9 Africa
6 Argentina 193 25 221 8.3 South America
8 Australia 261 72 212 10.4 Oceania
10 Azerbaijan 21 46 5 1.3 Europe
12 Bahrain 42 63 7 2.0 Asia
14 Barbados 143 173 36 6.3 North America
16 Belgium 295 84 212 10.5 Europe
18 Benin 34 4 13 1.1 Africa

 # Lets see how to get odd rows. 

df[['country','beer_servings','continent']][1::2].head(10)
 

country beer_servings continent
1 Albania 89 Europe
3 Andorra 245 Europe
5 Antigua & Barbuda 102 North America
7 Armenia 21 Europe
9 Austria 279 Europe
11 Bahamas 122 North America
13 Bangladesh 0 Asia
15 Belarus 142 Europe
17 Belize 263 North America
19 Bhutan 23 Asia
 

How to rename all the columns in a DataFrame in one-go?

In Python, there are many ways to achieve the same thing, and it varies person to person.

Below is the first method.

>>> df=spark.read.csv("/employees/employees.csv",header=True,inferSchema=True)
>>> df.printSchema()                            
                                
root
 |-- Emp ID: integer (nullable = true)
 |-- Name Prefix: string (nullable = true)
 |-- First Name: string (nullable = true)
 |-- Middle Initial: string (nullable = true)
 |-- Last Name: string (nullable = true)
 |-- Gender: string (nullable = true)
 |-- E Mail: string (nullable = true)
 |-- Father's Name: string (nullable = true)
 |-- Mother's Name: string (nullable = true)
 |-- Mother's Maiden Name: string (nullable = true)
 |-- Date of Birth: string (nullable = true)
 |-- Date of Joining: string (nullable = true)
 |-- Salary: integer (nullable = true)
 |-- Phone No. : string (nullable = true)
 |-- Place Name: string (nullable = true)
 |-- County: string (nullable = true)
 |-- City: string (nullable = true)
 |-- State: string (nullable = true)
 |-- Zip: integer (nullable = true)
 |-- Region: string (nullable = true)


Above schema has space,"." and "'S" character in the column names. 

Here is the one-line code to rename all the columns.

>>> df=df.toDF(*(x.replace(" ","_").replace("._","").replace("'s_","_").lower() for x in df.columns))
>>> df.printSchema()
root
 |-- emp_id: integer (nullable = true)
 |-- name_prefix: string (nullable = true)
 |-- first_name: string (nullable = true)
 |-- middle_initial: string (nullable = true)
 |-- last_name: string (nullable = true)
 |-- gender: string (nullable = true)
 |-- e_mail: string (nullable = true)
 |-- father_name: string (nullable = true)
 |-- mother_name: string (nullable = true)
 |-- mother_maiden_name: string (nullable = true)
 |-- date_of_birth: string (nullable = true)
 |-- date_of_joining: string (nullable = true)
 |-- salary: integer (nullable = true)
 |-- phone_no: string (nullable = true)
 |-- place_name: string (nullable = true)
 |-- county: string (nullable = true)
 |-- city: string (nullable = true)
 |-- state: string (nullable = true)
 |-- zip: integer (nullable = true)
 |-- region: string (nullable = true)


Now all the column names have changed with lower case.

Here is the 2nd method. 

def col_rename(df):

    for old_col in df.columns:

        new_col=old_col.replace("._","").replace("'s_","_").lower()

        df=df.withColumnRenamed(old_col,new_col)

    return df


df=col_rename(df)


How to load a textfile to Spark RDD and convert it to a Spark DataFrame?

import os

os.system("cat /home/mehaa/family.csv") -- Please use the path where the file is in your machine. On my machine I have saved the file in above path. 


rdd=sc.textFile('/home/mehaa/family.csv')

rdd.collect()


Now, we need to split the records. 

>>> rdd1=rdd.map(lambda x:x.split(','))
>>> rdd1.collect()
[['102', 'Gokula', '37', 'Mother'], ['103', 'Mehaa', '5', 'Daughter'], ['104', 'Rithihaa', '2', 'Daughter']]
>>>  

As you can see from the above image, we have 4 columns and 3 rows.

We need to provide the meaningful column names to those. 

We must import Row function to create the columns from the RDD.

 >>> from pyspark.sql import Row

>>> rdd2=rdd1.map(lambda x:Row(id=x[0],name=x[1],age=int(x[2]),reln=x[3]))


>>> df=rdd2.toDF()
>>> df.show()
+---+--------+---+--------+
| id|    name|age|    reln|
+---+--------+---+--------+
|102|  Gokula| 37|  Mother|
|103|   Mehaa|  5|Daughter|
|104|Rithihaa|  2|Daughter|
+---+--------+---+--------+

We can create DataFrame using createDataFrame method as well.

>>> df1=spark.createDataFrame(rdd2)
>>> df1.show()
+---+--------+---+--------+
| id|    name|age|    reln|
+---+--------+---+--------+
|102|  Gokula| 37|  Mother|
|103|   Mehaa|  5|Daughter|
|104|Rithihaa|  2|Daughter|
+---+--------+---+--------+


How to read Hive tables in PySpark? 

Here is the video. 


How to read MySql table in PySpark?

PySpark supports many data sources. Below are some samples.

CSV, JSON,ORC,Parquet, JDBC and etc...

Here is an example to read the data from MySql.


Code : spark.read.format("jdbc").options(url="jdbc:mysql://localhost:3306/employees?useSSL=false&user=root&password=mehaa1903",dbtable="departments").load().show()


What is BI(Business Intelligence)?

Business Intelligence:
Business Intelligence is a technology based on customer and profit oriented models that reduces operating costs and provide increased profitability by improving productivity, sales, service and helps to make decision making capabilities at no time. Business Intelligence Models are based on multi dimensional analysis and key performance indicators (KPI) of an enterprise.

What is OLAP(Online Analytical Processing)?
OLAP, an acronym for Online Analytical Processing is an approach that helps organization to take advantages of DATA. Popular OLAP tools are Cognos, Business Objects, Micro Strategy etc. OLAP cubes provide the insight into data and helps the topmost executives of an organization to take decisions in an efficient manner.

Technically, OLAP cube allows one to analyze data across multiple dimensions by providing multidimensional view of aggregated, grouped data. With OLAP reports, the major categories like fiscal periods, sales region, products, employee, promotion related to the product can be ANALYZED very efficiently, effectively and responsively. OLAP applications include sales and customer analysis, budgeting, marketing analysis, production analysis, profitability analysis and forecasting etc.

ROLAP
ROLAP stands for Relational Online Analytical Process that provides multidimensional analysis of data, stored in a Relational database(RDBMS).

MOLAP
MOLAP(Multidimensional OLAP), provides the analysis of data stored in a multi-dimensional data cube.

HOLAP
HOLAP(Hybrid OLAP) a combination of both ROLAP and MOLAP can provide multidimensional analysis simultaneously of data stored in a multidimensional database and in a relational database(RDBMS).

DOLAP
DOLAP(Desktop OLAP or Database OLAP)provide multidimensional analysis locally in the client machine on the data collected from relational or multidimensional database servers.

Dimensional Modeling
Dimensional Model comprises a fact table and many dimension tables and is used for calculating summarized data. Since Business Intelligence reports are used in measuring the facts(aggregates) across multiple dimensions, dimensional data modeling is the prefered modeling technique in a BI environment. A Fact table contains various measures or facts like sales amount, loan amount etc., whereas a Dimension table describes the particular entity like time, state etc., based on which the required facts are measured.

What is Datawarehouse?

A data warehouse is a relational/multidimensional database that is designed for query and analysis rather than transaction processing. A data warehouse usually contains historical data that is derived from transaction data. It separates analysis workload from transaction workload and enables a business to consolidate data from several sources.

In addition to a relational/multidimensional database, a data warehouse environment often consists of an ETL solution, an OLAP engine, client analysis tools, and other applications that manage the process of gathering data and delivering it to business users.

There are three types of data warehouses:
1. Enterprise Data Warehouse(EDW) - An enterprise data warehouse provides a central database for decision support throughout the enterprise.
2. ODS(Operational Data Store) - This has a broad enterprise wide scope, but unlike the real entertprise data warehouse, data is refreshed in near real time and used for routine business activity.
3. Data Mart - Datamart is a subset of data warehouse and it supports a particular region, business unit or business function.

Data warehouses and data marts are built on dimensional data modeling where fact tables are connected with dimension tables. This is most useful for users to access data since a database can be visualized as a cube of several dimensions. A data warehouse provides an opportunity for slicing and dicing that cube along each of its dimensions.

Data Mart: A data mart is a subset of data warehouse that is designed for a particular line of business, such as sales, marketing, or finance. In a dependent data mart, data can be derived from an enterprise-wide data warehouse. In an independent data mart, data can be collected directly from sources.

What is Star Schema?
Star Schema is a relational database schema for representing multimensional data. It is the simplest form of data warehouse schema that contains one or more dimensions and fact tables. It is called a star schema because the entity-relationship diagram between dimensions and fact tables resembles a star where one fact table is connected to multiple dimensions. The center of the star schema consists of a large fact table and it points towards the dimension tables. The advantage of star schema are slicing down, performance increase and easy understanding of data.

Steps in designing Star Schema
Identify a business process for analysis(like sales).
Identify measures or facts (sales dollar).
Identify dimensions for facts(product dimension, location dimension, time dimension, organization dimension).
List the columns that describe each dimension.(region name, branch name, region name).
Determine the lowest level of summary in a fact table(sales dollar).
Important aspects of Star Schema & Snow Flake Schema
In a star schema every dimension will have a primary key.
In a star schema, a dimension table will not have any parent table.
Whereas in a snow flake schema, a dimension table will have one or more parent tables.
Hierarchies for the dimensions are stored in the dimensional table itself in star schema.
Whereas hierachies are broken into separate tables in snow flake schema. These hierachies helps to drill down the data from topmost hierachies to the lowermost hierarchies.

Hierarchy
A logical structure that uses ordered levels as a means of organizing data. A hierarchy can be used to define data aggregation; for example, in a time dimension, a hierarchy might be used to aggregate data from the Month level to the Quarter level, from the Quarter level to the Year level. A hierarchy can also be used to define a navigational drill path, regardless of whether the levels in the hierarchy represent aggregated totals or not.

Level
A position in a hierarchy. For example, a time dimension might have a hierarchy that represents data at the Month, Quarter, and Year levels.

Fact Table
A table in a star schema that contains facts and connected to dimensions. A fact table typically has two types of columns: those that contain facts and those that are foreign keys to dimension tables. The primary key of a fact table is usually a composite key that is made up of all of its foreign keys.

A fact table might contain either detail level facts or facts that have been aggregated (fact tables that contain aggregated facts are often instead called summary tables). A fact table usually contains facts with the same level of aggregation.

Example of Star Schema:
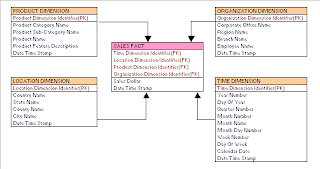

In the example figure, sales fact table is connected to dimensions location, product, time and organization. It shows that data can be sliced across all dimensions and again it is possible for the data to be aggregated across multiple dimensions. "Sales Dollar" in sales fact table can be calculated across all dimensions independently or in a combined manner which is explained below.

Sales Dollar value for a particular product
Sales Dollar value for a product in a location
Sales Dollar value for a product in a year within a location
Sales Dollar value for a product in a year within a location sold or serviced by an employee.

Snowflake Schema
A snowflake schema is a term that describes a star schema structure normalized through the use of outrigger tables. i.e dimension table hierachies are broken into simpler tables. In star schema example we had 4 dimensions like location, product, time, organization and a fact table(sales).

In Snowflake schema, the example diagram shown below has 4 dimension tables, 4 lookup tables and 1 fact table. The reason is that hierarchies(category, branch, state, and month) are being broken out of the dimension tables(PRODUCT, ORGANIZATION, LOCATION, and TIME) respectively and shown separately. In OLAP, this Snowflake schema approach increases the number of joins and poor performance in retrieval of data. In few organizations, they try to normalize the dimension tables to save space. Since dimension tables hold less space, Snowflake schema approach may be avoided.